


See what your audience thinks
Gather nuanced feedback and evaluate sentiment in real-time. Whether you are measuring the clarity of a concept or the quality of a presentation, this feature transforms passive polling into a precise data-driven conversation whilst seeing how responses are distributed across a group.
Capture the pulse of your audience
Capture levels, not just answers
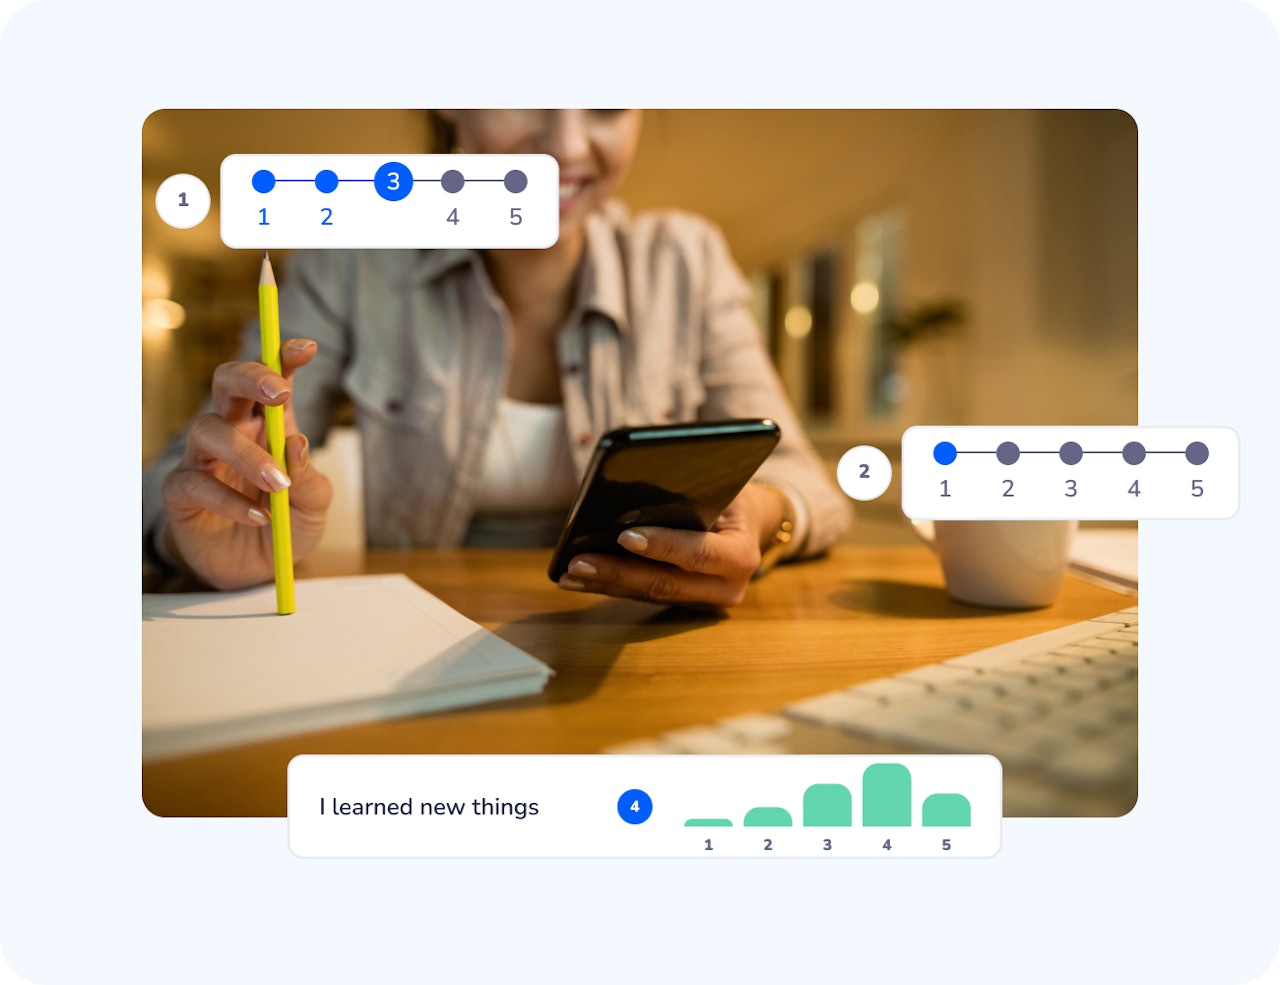
By asking participants to position themselves on a scale, you capture levels of agreement, confidence, or perception that reveal actual understanding.
Compare multiple elements consistently
With several items rated on the same scale, you can easily compare and visualize criteria, ideas, or aspects of a session without switching question types.
Support real-time facilitation
Live results make it possible to react during the session, whether that means clarifying a point, slowing down, or opening a discussion.
Reveal intensity and degrees of judgment
Unlike binary or single-choice questions, rating captures how strongly participants agree, understand, or value something. It surfaces gradients, hesitations, and contrasts, making visible the strength, not just the direction, of collective judgment.
Anchor discussion in a shared reference scale
By asking everyone to position themselves on the same scale, rating creates a common point of comparison. This shared reference makes it easier to interpret differences, justify perspectives, and move from opinion to structured dialogue, rather than scattered reactions.
How Rating works
Create a rating question
Select the Rating question type and write your instructions. Add one or more items or statements participants will rate.
Define your scale
Choose a scale that fits your goal, from 1–4 up to 1–10. The same scale applies to all items in the question to ensure consistency.
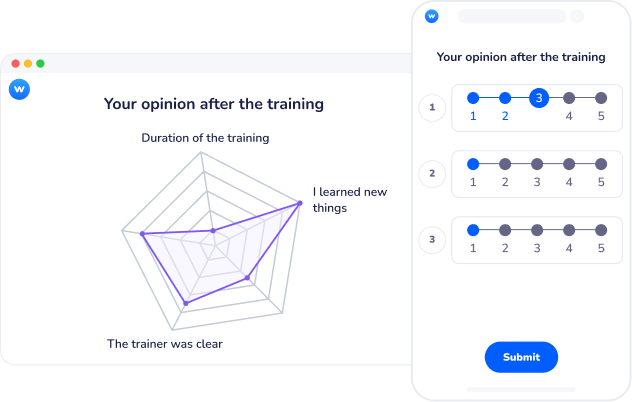
Collect and view results
Participants rate each item on their device. Results appear instantly and can be displayed as histograms or radar charts.
How teachers and trainers use Rating
Rating is useful whenever you need structured, comparable feedback from a group.
Course Evaluations
Gather instant feedback at the end of a lecture to measure how well students grasped the core learning objectives.
Confidence Checks
Ask learners to rate their comfort level with a new topic before moving on to more complex material.
Workshop Feedback
Use rating to let participants evaluate the relevance of specific brainstorming ideas or project proposals.
Icebreakers
Start a session by asking participants to rate their current energy level or their excitement about the day’s agenda.
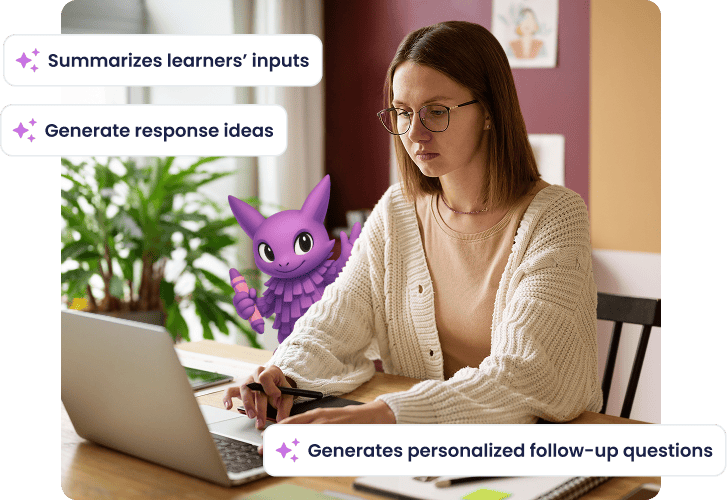
Get support while designing your activities
Wooclap’s AI agents help you move from ideas to structured activities more easily. They support question creation and review, helping you gain clarity and save time while you remain in control of every pedagogical choice.
Structured feedback, clearly presented
Customizable scales
Define the range of your rating from 1 to 10 to match the level of precision required for your specific activity.
Real-time average calculation
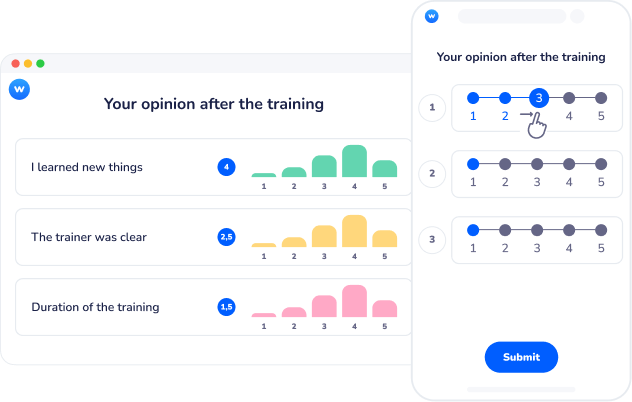
Automatically display the mean score as votes come in, giving you an instant snapshot of the group’s overall position.
Result distribution view
View how many people voted for each level to identify if your audience is in consensus or polarized.
Flexible media integration
Attach images to your rating question to provide visual context for what is being evaluated.
Post-event reporting
Export the rating data into Excel or PDF formats to analyze sentiment trends over time or across different cohorts.
Collect structured feedback at every key moment
Create a Rating question and see how your audience responds, live or on their own time.

Frequently asked questions
Have questions? We’ve got answers to help you !